Project Description
In collaboration with Amsterdam UMC
Gut organoids are stem cell derived 3D models of the intestinal epithelium. These models can be applied to study interaction between pathogens, such as bacteria or viruses and the gut [1]. This white paper contains end point measurements of developing gut monolayers derived from two separate donors.
Impedance spectroscopy was applied as an objective method for monolayer integrity verification of gut organoids in transwell with inserts. The TEER (trans epithelial electrical resistance), the resistance contribution attributed to the cells of interest, is a measure for the development stage of the monolayer and the integrity and can easily be extracted from impedance spectra. Reduction of repetitive tasks, improvement of reliability and time saving are benefits of the Artemis for monolayer integrity measurements.
In this white paper cells were in culture for 6 days and developed from an undifferentiated non-confluent monolayer layer to a confluent monolayer of undifferentiated cells on the day of the measurements. Details about the human 2D primary Organoid-Derived epithelial monolayer model can be found in Roodsant et al., 2020 [1].
Method and Material
Materials
- VWR 24 wells transwell plate with inserts coated with collagen (type I)
- Transwell inserts VWR (0.4 µm pore size
- Locsense ArtemisTM with smart-lid containing 24 gold plated electrodes.
- Two fetal gut organoid line:
- 18 week, passage 33
- 19 week, passage 22
- IntestiCult medium (Stemcell)
- Microscope EVOS M5000
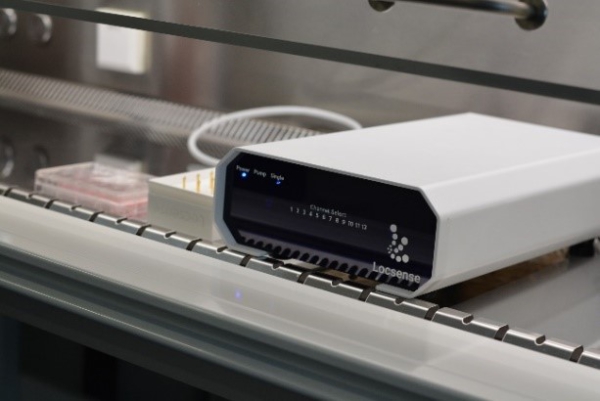
Cells were seeded in a monolayer on Transwell inserts and cultured in IntestiCult medium + 1% PenStrep (100 µL apical side and 600 µL basolateral side) (5% CO2, 37 ºC). The cells were in culture for 6 days, on the day of impedance spectroscopy measurements and were obtained from 2 separate donors. The impedance measurements were performed inside a flow cabinet, see figure 1.


Results and remarks
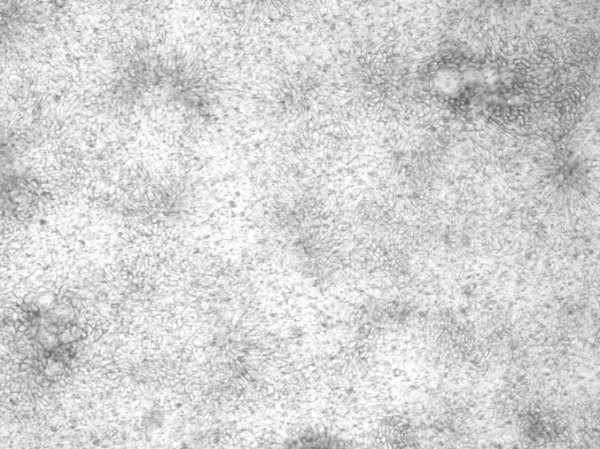
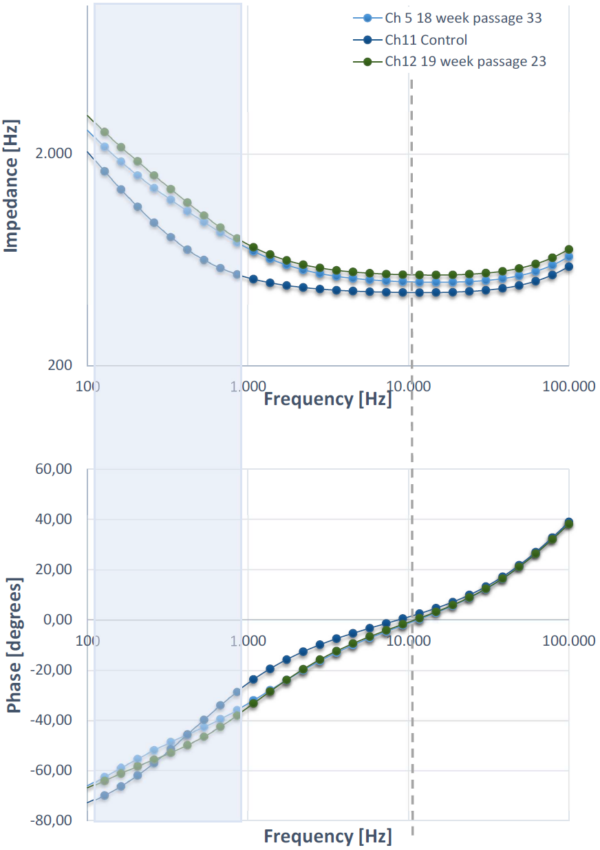
The resulting impedance and phase plots for three samples are shown in Figure 3. A microscopy image of the cells in culture in shown in Figure 2. The control measurement consists of a collagen coated empty insert. Two graphs are shown of gut monolayer cell cultures from different donors. The grey dashed line indicates, the frequency at which the phase shift induced by the sample under test is 0. This corresponds to a plateau in the impedance plot, corresponding to a region in which the impedance value is equivalent to a pure resistance. As expected, the control corresponds to a lower overall impedance. The effective resistive contribution from the cells, also TEER is determined at 53 and 94 Ω, for 18 week passage 33 and 19 week passage 23 respectively. The spectra from the cell cultures correspond to a larger overall impedance value. A cumulative effect of increased capacitance and resistance is visible in the shaded blue zone.
Follow up experiments at a range of time points prior to the fully developed monolayer, including fitting of the data to an equivalent circuit model will provide more insight into the contribution from the monolayer, tight junctions and the capacitive effect due to the cellular membrane.

